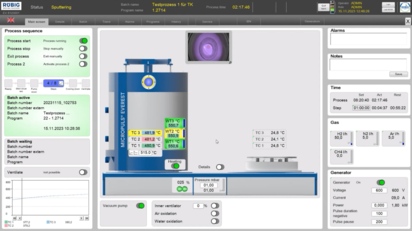
After the successful rollout of RUBIG’s next-generation system visualization, the solution now enters its next phase: A powerful analysis tool that simplifies evaluations and enhances process control efficiency.
RUBIG Analysis Tool for Efficient System Visualization
Why you should rely on the
NEW RUBIG ANALYSIS TOOL for system visualization
Process deviations become clearly visible
Past processes and their trends are easily compared with defined standards, making deviations immediately visible through intuitive visualizations.Not only experienced process engineers, but also newcomers, can identify discrepancies at a glance and take targeted action.
This significantly reduces the effort required for quality management.
Avoid unplanned machine downtime
It’s every production manager’s nightmare – unexpected machine failure. Often, early signs are already reflected in the recorded trend data.
Detailed process analysis provides all the key information needed for predictive maintenance, helping to increase machine availability.
Fully automated recording and evaluation
For efficient operation, detailed consumption tracking is essential – and in some certification processes, it’s even a minimum requirement.
The analysis tool automatically records all consumptions, trends, modifications, and alarms, drastically reducing documentation workload.
- Smart spare parts management
By combining machine data with historical maintenance information, spare parts can be made available precisely when needed.
This reduces inventory costs while still avoiding unplanned downtime.
Industrial Furnaces - After Sales Service

Personalised Consultation on the RUBIG Analysis Tool
The RUBIG Analysis Tool is your key to efficient process control. I will be happy to provide you with personal and non-binding advice. Let’s rethink efficiency together!
Werner Fischer
Department manager Aftersales


